Welcome to the third edition of Schools that Excel, an annual series in which The Age celebrates schools that achieve outstanding improvement in their VCE results.
The truth is, we almost didn’t run this year’s awards. It initially seemed unfair to compare the VCE class of 2020, who missed as much as 16 weeks of in-class learning, with previous years.
Sirius College is Schools that Excel non-government school award winner for Melbourne’s north. Credit:Eddie Jim
COVID-19 made 2020 an incredibly difficult year for students, teachers and parents at all Victorian schools.
As Sami El’Souki, a VCE student at Sirius College, one of our winning schools, put it: “It was harder because the [normal] teacher-student relationship was out. It was harder to ask questions.
“At school you’re surrounded by students and you’re all motivated together. It creates a great atmosphere to achieve good results.”
Nor did it seem fair to rank schools’ raw results against each other given the pandemic’s impact was so uneven, with some schools forced to close for weeks due to an exposure while most others were still open.
But last year the Victorian Curriculum and Assessment Authority ensured students and schools that were worst affected would not suffer a disadvantage to their VCE results as well, applying a process of individual consideration of academic disadvantage due to COVID-19.
Half of VCE students applied, and the VCAA boosted their results in line with what they would have achieved in normal times. It meant results did not fluctuate wildly from the norm last year.
As the class of 2021 log on at home this week for their third stint of remote learning this year, it is conceivable many will seek special consideration. The trials VCE students endured last year might be less of an outlier after all.
We have chosen to run the Schools that Excel series in 2021 because it is an opportunity to recognise schools that have shown sustained improvement over the past 10 years, as well as celebrating students’ resilience during 2020.
Of course, improved results are worth celebrating not on their own but because they signify more students achieving their ambitions.
“That’s what teachers care about,” says Andrew McNeil, principal of Reservoir High School (another winner this year).
“They don’t care about kids’ median scores; they care about their pathways.”
Recognising schools that improve
The Schools that Excel interactive brings together detailed results from Victorian government, independent and Catholic schools.
The Age has gathered VCE results data going back 10 years for every secondary school in the state and turned it into an easy-to-use dashboard.
Simply type in the name of your school to find out how it has fared over the past decade, what its graduates do after finishing and more:
What can I learn from this interactive?
The interactive lets you gauge a school's VCE performance over 10 years, so you can see whether it has improved or maintained its results over time.
When VCE results are released in December, only the current year's figures are provided. That information is useful, but it doesn't tell you anything about how representative the results are of the school's typical performance. By threading together data from the past decade, a much clearer picture emerges.

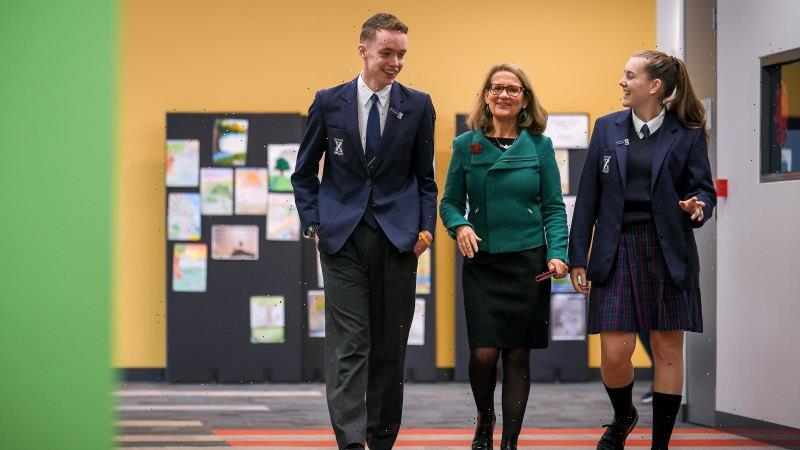
Casey Grammar principal Fiona Williams with year 12 students. Casey Grammar was named the Schools that Excel winner among non-government schools in Melbourne’s south.Credit:Joe Armao
You can also see how students enrolled in VET or VCAL programs fare and whether they continue on to vocational education or apprenticeships. Not all schools cater to students who are predominantly after a place at university, and the Schools that Excel dashboard reflects this.
With so much information about the vital final years of secondary education in one place, the dashboard helps you research the schools in your area and could help you select one that is a good fit for you or your child.
What does the dashboard show?
The information about your school is divided into multiple panels. Here is a guide to interpreting the data:
Average student performance shows the median VCE subject study score for the school since 2011, which is a good indicator of typical student achievement. Study scores are out of 50, and a 30 is the average. The horizontal line at 30 on the graph is the yardstick that shows how the typical student at this school fares against the statewide average.
High achievers shows the percentage of the school’s VCE subject scores that were among the best in the state. These are scores of 40 or above, which put students within the top 10 per cent of all those who completed a VCE subject. This panel also shows the subjects in which students obtained the best results.
Completion rates shows the enrolment numbers in VCE, VET and VCAL over the past five years, as well as the satisfactory completion rates among year 12s.
Student pathways shows what 2019’s year 12 graduates were doing midway through last year – whether they had gone on to further study at university or TAFE, or whether they had taken on an apprenticeship or joined the workforce. This panel does not show up if a high percentage of a school’s year 12 graduates did not complete the survey. The survey has not been conducted for 2020’s graduates yet, so 2019 is the latest year for which data is available.
School awards shows the 10 high-gain schools that The Age judged as having shown the best improvement in their results over the past decade.

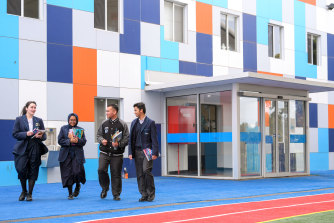
Keilor Downs College principal Linda Maxwell with some of her students, who thrived despite COVID disruptions. Keilor Downs was named a Schools that Excel winner among western Melbourne government schools.Credit:Jason South
Which schools are featured in the dashboard?
The interactive dashboard features data on more than 500 Victorian schools that offered VCE, VET or VCAL programs in 2020.
It also includes schools that were classified by the VCAA as “small” for having enrolments below a certain threshold. A dialogue box will pop up in the interactive if you enter the name of a small school to flag that its performance may not be comparable with larger schools and that it may not be possible to observe a trend in results over the 10-year time frame. If a school has few students, it means the median can fluctuate greatly year on year depending on the cohort.
Unfortunately, schools for which there is insufficient data, schools that exclusively offer the International Baccalaureate and adult education institutions do not show up in the interactive.
There might also be gaps in the data for years in which student enrolments did not reach a certain threshold.
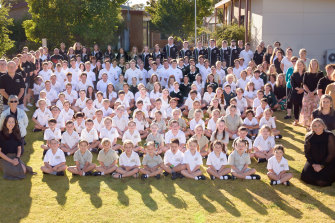
A whole-school photo of Tyrrell College, which was the winner among rural/regional government schools.
How were the Schools that Excel awards decided?
We used Department of Health boundaries to categorise schools as metropolitan or regional and divided the metropolitan region into west, north, east and south Melbourne.
One government school and one non-government (Catholic or independent) school was chosen for each area based on their records of improvement.
Of course, there are many qualities in schools that can’t be measured. These include a school’s culture, its inclusiveness, the dedication of teachers, extracurricular activities and that feeling you get when you walk through the school gates.
[Follow The Age Education on Facebook]
The Morning Edition newsletter is our guide to the day’s most important and interesting stories, analysis and insights. Sign up here.
Most Viewed in National
From our partners
Source: Read Full Article